Basics
A so-called Scace Espresso Machine Thermofilter can be used to determine temperature curves and the temperature stability of a machine.
The Scace thermofilter simulates the coffee through a plastic block that has similar thermal properties. However, you cannot measure real espresso extractions with a Scace, as the coffee crumbs will immediately clog the nozzle. Statements such as "my machine makes the best espresso shots at 93 °" can certainly not be made with a Scace.
For this reason, you must not use an espresso machine for measurement that still has traces of the real extractions somewhere. If in doubt, you have to remove the shower screen and painstakingly clean everything, ideally 1 hour before the start of the measurements.
However, you can check within certain limits whether the espresso machine remains stable under low or high loads and does not heat up or cool down. However, it is not enough to read off a degree at any given time. There is, however, a precisely defined measuring process that allows the temperature stability to be determined by a number at the end.
In order to carry out such a measurement you need some preparation and appropriate equipment: the Scace itself, two stopwatches, a data logger and ideally you film the measurement process for documentation.
The measurement
The measurement with a Scace is quite clearly defined (but leaves some latitude). The measuring process and the evaluation are defined here:
PROCEDURE FOR THE MEASUREMENT OF BREWING WATER TEMPERATURE IN ESPRESSO COFFEEMACHINES (2017)
And you can find a decent collection of evaluation results here:
Die Röster — Freak-Artikel: Wir haben Temperatur-Präzision bei Espressomaschinen getestet
It is really worth reading through these explanations from our Austrian colleagues. Unfortunately, the article is available in German only.

Prepare the machine
When it comes to the reproducibility and comparability of the measurements, it is advisable to set up the espresso machine freely in a space that is not too small and to exclude environmental influences as far as possible. Above all, this includes: air drafts and high room temperatures.
Then you determine how long the espresso extraction time of the machine is to get 25ml of liquid per cup (50 ml in total). The length of an extraction (or the amount of liquid conveyed) has more or less influence on the temperature curves and, of course, on the comparability.
Machines with a timer make it easier to measure. Machines with manual start and end of the extraction (like a machine with an E61 group) make the measuring process a bit more demanding. An additional stop watch should therefore be used to record the extraction time (or its end respectively).

Preparation of the measurement
As described in the text above, the machine should be heated for 1 hour. This is a value at which every machine/ brew group will really have reached its temperature
Since you have to extract the measurements from the data logger file later, you should strictly adhere to the timing (including the pauses between extractions) specified in the document, because otherwise you will spend quite some time searching through the many measured values (apart from the fact that the comparability will be lost).
In order to get the measuring process right, it is best to use a table to tick off the individual steps, which is particularly helpful in the second half of the measuring cycle when it gets hectic because the temporal distances between the extractions will become very short.
If the starting points of the extraction times are already shown in the table, the work will become much easier. A stopwatch is used for this, which is started at the same time as the data logger. For example, if you start the first extraction after exactly 2 minutes, you can simply go by the stopwatch and the calculated times of the following extractions from there.
Nevertheless, it is advisable to write down the exact start time of each extraction, because you do not always hit the calculated point exactly and later it is difficult to recognise the correct values in the data pool.

Since the Scace produces a very fine and sharp jet, it is best to place a small sponge in the drip tray. This very well reduces the formation of a fine mist under the brew group, which can indeed have a cooling effect.

Evaluation
A measurement cycle takes around 35 minutes and then you can evaluate the data from the data logger according to the definition.
In a spreadsheet such as Excel you can very quickly get an impression of the evenness (or unevenness) of the extractions, which is quite suitable for an initial assessment.
When comparing the 'peaks', you should not be able to detect any significant increases or decreases—this is a first indication of good stability in the extractions — then this is a first indication of good stability in the extractions.


The temperature stability can now be calculated in accordance with the definition in the linked document in Excel. For this purpose, the standard deviation is calculated for each extraction and this results in a total standard deviation that is multiplied by 2.
The values will always be slightly different from measurement to measurement and from machine to machine (of the same type). This also applies to the Xenia, even if we calibrate or adjust every machine. The fluctuations are also irrelevant and a machine that has a value below 1.1, for example, will hardly achieve a value above 5 in another measurement.

The measured values are recorded twice: once as a data record (see the link below for the evaluation by Excel) and once as a video so that authenticity can be checked and manipulation can be excluded.
Measurement with flush
The document describes some optional actions of the measurement cycle, such as the simulation of steaming/ frothing and a flush of the brew group.
As is well known, the Xenia has been developed so that it does not need a cooling flush. At the same time, this means that a flush in Xenia is counterproductive. Nevertheless, you can complete the measuring cycle with a flush provide you stick to the exact timing of flushing for almost exactly 5 seconds: start of the pump until the end of the extraction period = 5 seconds = water flows out of the brew group for 2 seconds.
If you want to complete the measuring cycle with flush with another machine, it is advisable to determine this time in advance — for example with a brew group thermometer.
For comparison to the measurement documented above, this measurement was carried out with flush:
Measurement with frothing
If you want to take a measurement with foaming, you first have to determine how long it takes to bring 300ml milk to 60 ° C. With the 2-hole nozzle this takes about 35 seconds.
You have to start frothing immediately at (or shortly before) the start of the extractions and stop foaming about 10 seconds after the extraction is finished since the extractions are shorter in time. This is really tricky at the end, especially with the short intervals.
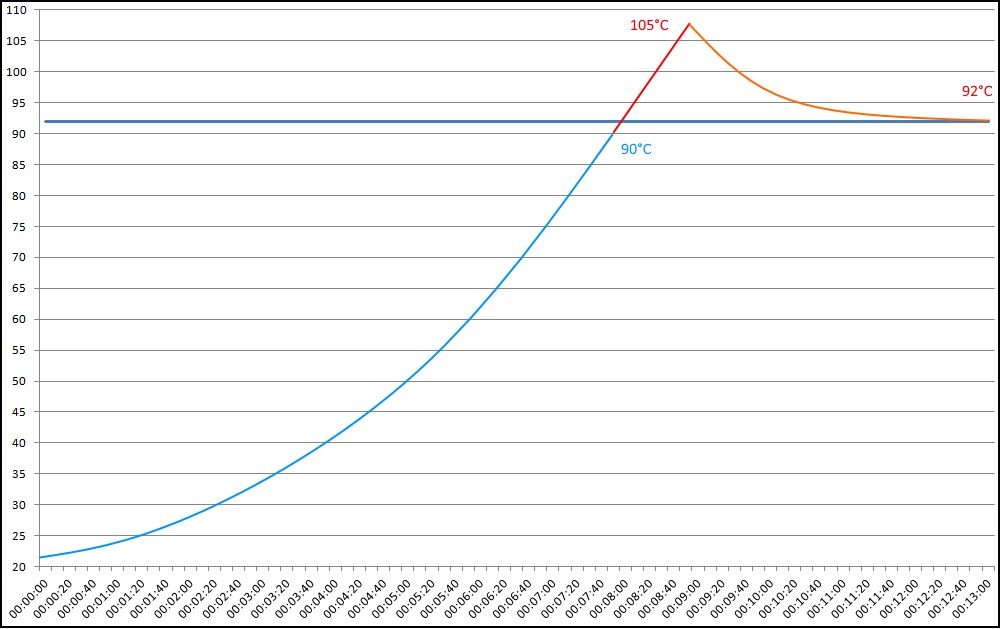
In the following recording, it was forgotten to start the drawing with activated heating for the first extraction. And the 11th extraction went completely wrong because the boiler was refilled shortly before. The intensive steaming of the previous 10 draws causes the water level in the boiler to drop gradually and so cool water was pumped into the boiler shortly before the 11th extraction. The extraction was started late and had to be stopped soon because the next extraction should start according to plan.
You can see in the graphic on the right that the extraction runs cooler because the boiler pressure was still very low due to the cold water. Since the following extractions had to be stopped every 10 seconds, this dent can also been seen in the following extractions.

Overall, however, the loss was very moderate at 1.1 ° C on the first subsequent extraction. The brew group with the turbulator has effectively prevented a significant drop here.

Private File - Access Forbidden
Measurement 11 was excluded because of the error.
Other Machines / Settings
The question is, of course, whether this is the case with every machine and whether other settings (longer extractions, different boiler pressure) change something in the result. The above measurements were all carried out on a series machine.
A different machine was used for the following measurement, which is operated with a extraction duration of 30 seconds (standard) and a higher boiler pressure.
Criticism and evaluation
Of course, the measurements with a scace measuring insert do not represent 100% of reality. There are several indications for this. To name just one: The mass of plastic may have similar values (heat capacity/heat conductivity) as coffee grounds. But it does make a difference whether the water is pressed through the coffee grounds or just passed by a plastic block. When the ground coffee is knocked out after brewing, a lot of energy is also removed from the system, which does not happen when using a scace measuring insert.
Critically, one can also see that such measurements are somewhat idealised. Machines are also placed in draughts or in corners where there is no proper air circulation. Nevertheless, it makes sense to create ideal conditions for a measurement in order to achieve comparability. It would certainly be interesting to map all changing conditions, but this is hardly possible. The better a machine performs in this measurement/evaluation under controlled conditions, the better it is likely to cope with less ideal conditions.
In this context, it should also be mentioned that we did not carry out the optional temperature change described (whereas we did carry out measurements with frothing and flushing).
How meaningful is such a value? In general: A standard deviation, which is determined by series of measurements, is certainly a much more realistic value than a single degree value read from a scace gauge at some time and viewed as the 'brewing temperature’. A scace used in this way is hardly used sensibly.
The calculated standard deviation in connection with the measuring cycle is to be regarded as a kind of overall view or fingerprint of a machine in form of a number (score).
Are machines with a high score automatically worse than machines with a low score?
You can't say that across the board, and you can certainly also state that in home use this figure is much less important than at world barista championships. Of course, this reading has no value at all, even in a bar in Italy.
In the end, it is always decisive how good the espresso tastes and this is primarily due to the roaster and the correct settings of the grinder.
Assessment of measured values
The previous section presented the factors that cause a measurement via a scace to deviate from reality. –although these measurements already have significance. They show whether a machine is capable of making shots repeatable. This is an important feature, because in principle you only have to concentrate on the grinders and their settings. The real brewing temperature is not known, but it can also be ruled out as a cause because it always develops in the same way during brewing.
In fact, however, it is also possible to approximate the real temperature with the appropriate effort.
What is clear about the scace's design is that it has a space to fill that is below the brewing temperature. Before that, the temperature of the inflowing water is only displayed increasingly–and not immediately. On top of that, the sensor and the meter do not react in milliseconds. The longer the extraction takes, the closer we come to the real temperature (to be precise: the mixed temperature over a period of time). But if we only know the last value of the extraction, we cannot determine whether there are strong fluctuations during brewing.
With a refrigerator and an espresso machine where you can turn off the heating(s) and a spreadsheet like Excel, for example, you can at least work out the rough deviation and determine a correction factor (more precisely: a correction factor series).
The idea is: A machine that is not warm will always pump water at room temperature into the group and into the scace. This means that the actual temperature is known throughout the entire brewing process: namely constant at room temperature. Since the scace is usually always a few degrees cooler, the refrigerator (or freezer) can help us here to create the temperature difference. If the scace is in the fridge for 2 hours, it is certainly colder than the brew group—and this corresponds 1:1 to the reality of measurements with the heating switched on.
Now you can record an espresso pulling and the result reflects what was outlined above.

Now you get the correction values per second from the measurement curve for the constant water temperature.
Strictly speaking, there is of course also a small deviation with this method—which is due to the inertia of the sensors. Thus, the rise of the measurement curve is probably somewhat stronger in reality.
A moderate increase in temperature over time indicates that the brewing process is running constantly. Machines whose readings are straight, on the other hand, in reality indicate a drop in temperature in the process.
What this correction cannot do: Record strong fluctuations at the start of brewing, as can be expected with thermoblock machines or machines with a large heat exchanger.